The ABS most recent publication on Australian mortality experience was released towards the end of May, with the rather noteworthy key point that for the first two months of 2022, all cause mortality is up over 20% compared to normal, Figure 1.
When it comes to vital statistics of mortality, departures of this magnitude are rare, indeed. This represents about two standard deviations (more on that below) over the baseline, which was measured over the seven calendar years to 2021 inclusive. So, I obtained the full set of data from the ABS website to review the results in more detail, given the data are broken down by state, age group, cause of death and by both sexes.

In broad terms, the baseline weekly average number of deaths in Australia in the baseline period has been 3,100. For the first eight weeks of 2022, it has averaged 3,500. Firstly, it is not really a geographic issue. All states (except NT) reported increased deaths. The proportional increases were largest in NSW, Victoria and Queensland. Secondly, it is not really about differences between the sexes. Yes, male deaths increased proportionately more than female deaths but not by so much as to warrant further investigation.
It is in the areas of age groups and cause of death that differences emerge. On the age groups, deaths have remained broadly on trend for everyone up to age 65. It is in the age 65 to 84 bracket that the increases were very large. Oddly, perhaps, the number of deaths in the over 85 year old bracket actully reduced relative to trend. Note that these numbers are raw deaths, not scaled or adjusted for changes in population size or other factors. Still, the population has been reasonably stable in the last decade especially so in the last two years.
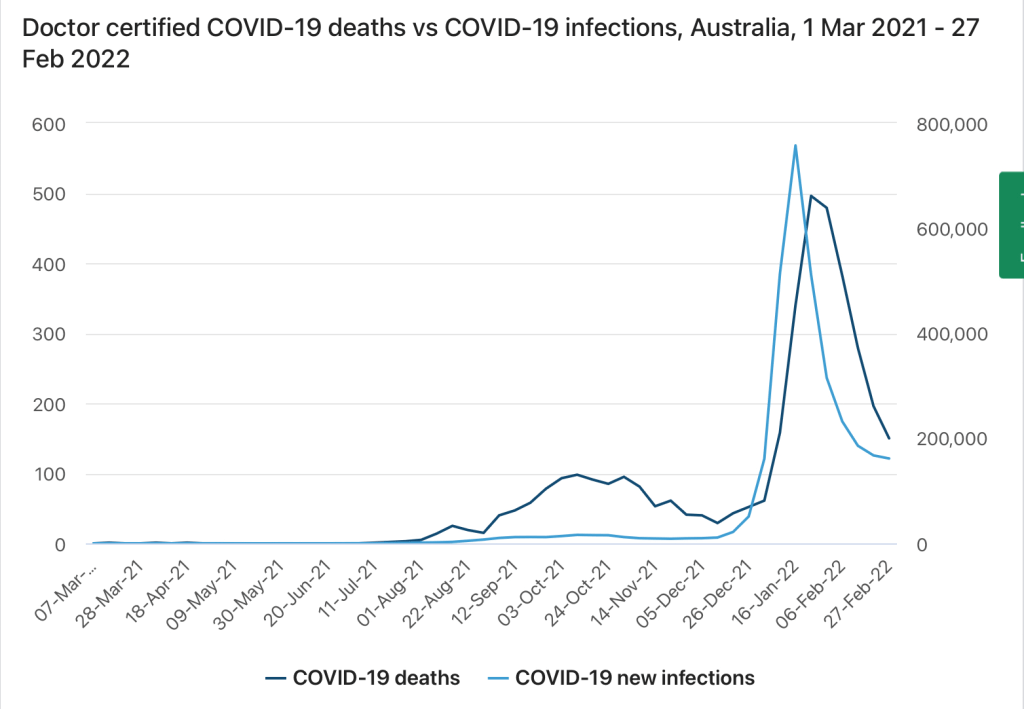
On cause of death, COVID deaths spiked upward in early 2022 (see Figure 2). But that explains only part of the overall increase. Deaths from cancer, dementia and diabetes were all up. Respiratory diseases contributed fewer deaths and heart disease, flu and pneumonia deaths were all consistent with trend.
There is the concept of a multiple decrement table used in actuarial work, by which a population (or subset) is being analysed and decrements (that is exits from the group) can happen by more than one mode. For example, the more people that die from COVID means fewer remain exposed to the risk of death from cancer, say. There are some elegant maths behind these models. Before you think I’m digressing, my point is that despite the substantial number of ‘new’ deaths from COVID in 2022, deaths from cancer, dementia and diabetes also increased. That means the underlying causes of those diseases could be significantly higher in scope or effect. As the COVID deaths fall away, already obvious from this data, will cancer, dementia and diabetes deaths increase even further?
Furthermore, the age group 65 to 84 is the dominant source of these extra deaths. The number of people in this bracket is a relatively small proportion of the overall population which points to a very much higher increase in mortality rates in that age group. I suspect we could be dealing with more than two standard deviations that the all cause all age group data shows.
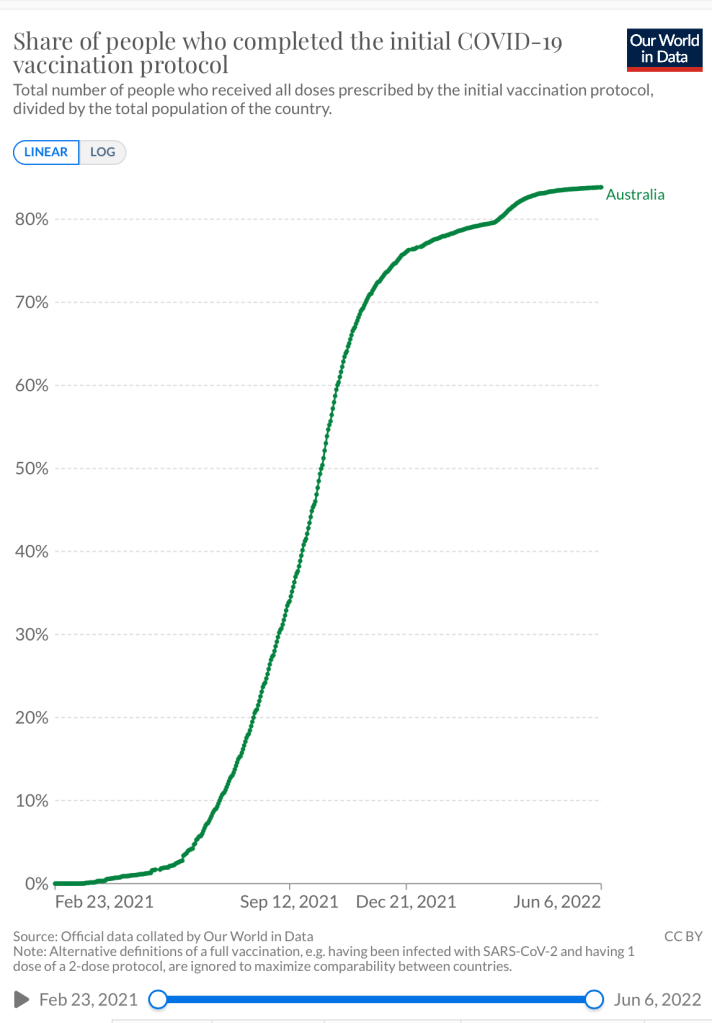
The COVID spike in deaths happened after around 83% of the population was fully vaccinated (see Figure 3). That suggests the vaccines neither prevent infection or death. Deaths by age bracket were not presented for the indiviual causes of death, but by the age bracket results overall, it would still seem to be the case that COVID deaths are skewed to the elderly.

[…] to the non COVID excess mortality data in Australia that I assessed at this post, data from the US is well established in a similar […]