Way back in June 2020 when Guy Debelle was still employed by Australia’s Reserve Bank (RBA), he made a speech in response to market jitters over the unprecedented expansion of bank credit. He said it would not lead to inflation.
In November 2021, the RBA Governor Lowe said he wasn’t expecting inflation to hit the 2% to 3% pa target range until late 2023 and so there would be no interest rate increases in 2022 but maybe there would be in 2023.
Update from 17 June, 5:30 pm AEST: coal and gas are currently producing 78% of Australia’s electricity supply.
We need more renewables, obviously. Look at the contribution to Australia’s energy supply over the last 48 hours. After decades of subsidies to promote windmills, solar panels, hydro schemes and biofuels, the total output of renewable sources is woefully tiny. Not enough subsidies, I expect.
Being asleep at the wheel. Being like a rabbit caught in the car’s headlights and too frightened to move. Struck dumb. Several phrases, none of them polite, but each of them could be applied to the senior executives of Australia’s Reserve Bank, the RBA. No competent person in a position of authority at the RBA would keep in place the current monetary policy settings.
Milton Friedman coined the phrase “inflation is always and everywhere a monetary phenomenon”. He would have been aghast, I think, if he were still around to see this chart of the US monetary base:
Germany is the largest economy in Europe. Things are not going well there. It is less than four years ago that President Trump spoke at the UN and was openly laughed at by the German delegation. Trump’s laughable comments, as perceived by the Germans, were to warn of impending serious problems since Germany had deliberately wound back its power generation capacity in favour of long term access to Russian gas.
Now look what two stories appear on the same page of the FT:
Did anyone see the report the other day that a study by the Centre for Independent Studies found that university places in Australia could be increased by 80,000 at no extra cost? What? How is that possible? It turns out that the cost savings could be made by removing doubling up in taxpayer supported placements. Double degrees etc. Now, ask yourself this: would removing doubling up in taxpayer support to create savings such that 80,000 extra students could enter university be a good thing?
It is normal around this time that people consider the upcoming year and even make predictions about what may happen. This year, I’m not going to do that. Instead, I will make predictions about what won’t happen in 2022.
The world runs on fossil fuels. So soon after the latest climate gabfest, this time in Glasgow, and the strategic oil reserve is being opened up. Certain foot-stamping teenagers will not be happy.
It seems that suddenly everybody is talking about inflation. Better late than never, I guess. In Australia, the inflation rate for the full year to 30 September 2021 was 3.1%. The September quarter price index rise was said to surprise economists and the bond market traders. Some Chief Executive Officers of large Australian companies have begone warning their consumers that price rises will be on-going. I know that in some industries, suppliers are giving notice of impending price rises closer to 10%. Producer prices are increasing rapidly and that will eventually feed its way into consumer prices. The Consumer Price Index is the favoured inflation measure of many people, but producer prices give a better lead indication. Continue reading →
I am unaware of any country other than Sweden that has taken a targeted risk mitigation strategy to deal with SARS-COV-2. It appears to me that the citizens of other countries have been treated as amorphous, to be pummelled towards the impossible goal of virus elimination. “We had to destroy the village in order to save it.” That cliched quotation, supposedly from a US army general in Vietnam, may be a myth, but it does describe the apparent attitude of most governments in response to COVID19.
Risk mitigation has costs. Therefore, mitigation techniques should be applied only where they are needed and only if they can be reasonably expected to work.
Using Europe as an example, here is the median age data by country:
Across the continent, the median age is less than 44. (It has created up to around 46 in some countries.) That means more than half the European population is aged less than 44.
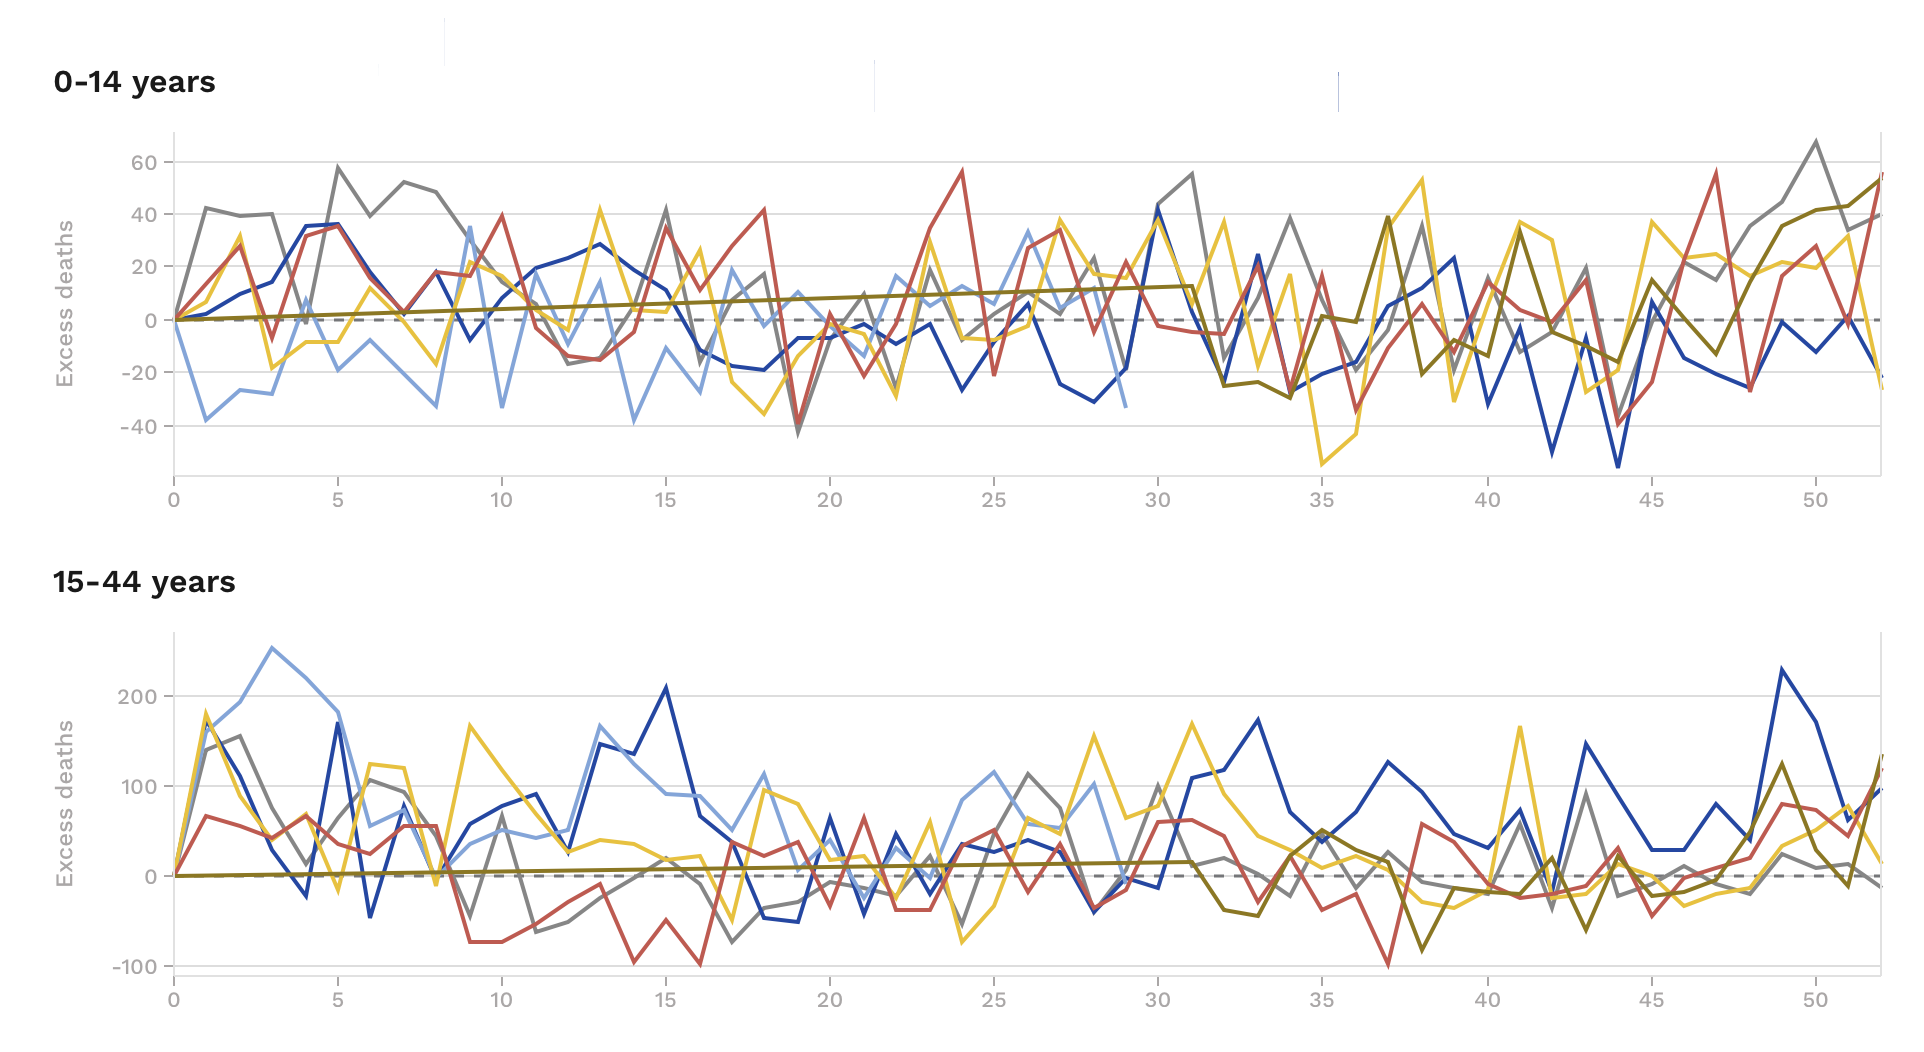
With that in mind, consider the mortality experience of the last 5 years up to the end of 2020, plus year to date 2021. This comes from the European Mortality Monitoring study that collects data from 29 participating countries. The following chart shows excess deaths (ie different from normal, where normal is based on continuous mortality investigations) for ages up to 44. Each line represents a calendar year of data, split by weeks 1 to 52. I have deliberately withheld the legend so that the lines are not identifiable as any particular year. Your challenge is to guess which coloured lines represent 2020 and 2021.
This analysis ought to inform policy response and mitigation targets. More than half the population is being hammered financially, psychologically and socially unnecessarily.