If I told you that Covid restrictions were about to be re-invigorated, you would reasonably dismiss me as a looney. Right? Stay tuned.
COVID19
I was wrong
A little over three years ago I wrote a piece that posited the almost global Government reaction to Covid19 was an overreaction. I thought that it would take no more than 6 months for people to realise this.
I was wrong. It took a lot longer.
Actuaries, doctors, demographers, politicians, drug approval agencies – are you curious about this?
It’s a bit odd, don’t you think? Australia vs World experience. Why would higher rates of covid19 vaccination in Australia coincide with higher rates of mortality? Curious.
Continue readingI think we’ve heard more than enough from leading modellers

This person is giving leading modellers a bad name.
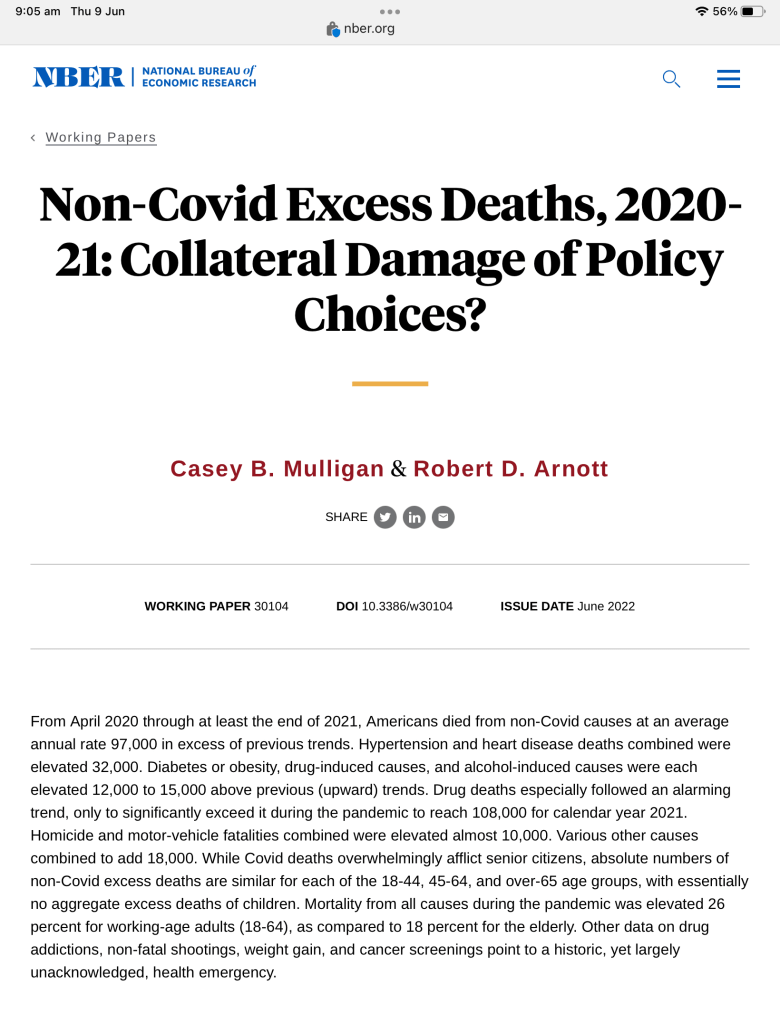
US excess mortality
Further to the non COVID excess mortality data in Australia that I assessed at this post, data from the US is well established in a similar vein.
How multiple decrements and standard deviations affect Australia’s senior citizens
The ABS most recent publication on Australian mortality experience was released towards the end of May, with the rather noteworthy key point that for the first two months of 2022, all cause mortality is up over 20% compared to normal, Figure 1.
When it comes to vital statistics of mortality, departures of this magnitude are rare, indeed. This represents about two standard deviations (more on that below) over the baseline, which was measured over the seven calendar years to 2021 inclusive. So, I obtained the full set of data from the ABS website to review the results in more detail, given the data are broken down by state, age group, cause of death and by both sexes.

Conflicts of interest
There appears to be little doubt that many doctors have been conflicted in their efforts to deal with Covid19.
This film asks reasonable questions of one doctor in particular.
Foot fault
Djokovich has done the Australian people a service. The cancellation of his visa after arriving in Australia for the Australian Open tennis grand slam will attract a lot of media attention globally. At this stage, global attention on Australia’s COVID19 rules is welcome.
Continue readingWhat’s this warning about?
www.bbc.co.uk/news/health-59542211
Who is she warning and why? What does she think should be done about it?
If no action is necessary then why issue a warning?
The latest COVID strain
It’s the Omicron strain. Or as I prefer, the OMG strain. Viruses mutate, particularly so in response to mass vaccination. No surprises in this quarter. This strain is likely to consider both the vaxxed and the unvaxxed as fair game.
Update: increased government restrictions as a result of this strain apply to all people regardless of vaccination status. The UK has gone even further: to remain classed as vaccinated, booster jabs are now to required once every three months. (Cognitive dissonance alert for those readers who prefer government actions to be coherent.)
