One of the actuarial profession’s valuable contributions to the management of long term financial risks in the field of life insurance has been the development of credible models of human mortality. The humble life table. Over the years (going back several hundred), the techniques have resulted in this fundamental component of fair and equitable pricing and reserving for mortality risk. The table’s contribution to the welfare and advancement of people has been important. But have these techniques been forgotten or ignored by climate change zealots?
The actuary is pragmatic. Theoretical mathematical models of mortality have been developed but they have only ever been able of giving a guiding picture. Human mortality patterns do not slavishly follow a mathematical model. The established method of updating life tables has been to periodically collect data about deaths and recalculate the rates of mortality then re-graduate the raw results into a credible and smooth table.
Changes in mortality rates over time are identified by comparing the actual experience emerging with the expected experience. This technique is also helpful in assessing how accurate predictions of mortality improvements have been – by comparing the actual experience with the predicted.
Over time, predictive models are adapted to fit the actual experience. If the model’s predictions do not match actual experience, the model must be wrong.
Meanwhile, I have to wonder whether this well established technique has been ignored by some actuaries who exhibit interest in climate change. I am increasingly of the view that some actuaries are giving more credence to the ‘expected’ and less to the ‘actual’ when it comes to climate change. To be sure, climate change models predict catastrophic damage to the climate – they have been predicting that en masse for at least the last 17 years. However, the ‘actual’ is paying not so much attention to the ‘expected’ when it comes to temperature. Where is the actual vs expected analysis?
Look at the table of data here, reproduced from the Australia Pilot, volume II, 5th edition from 1969.
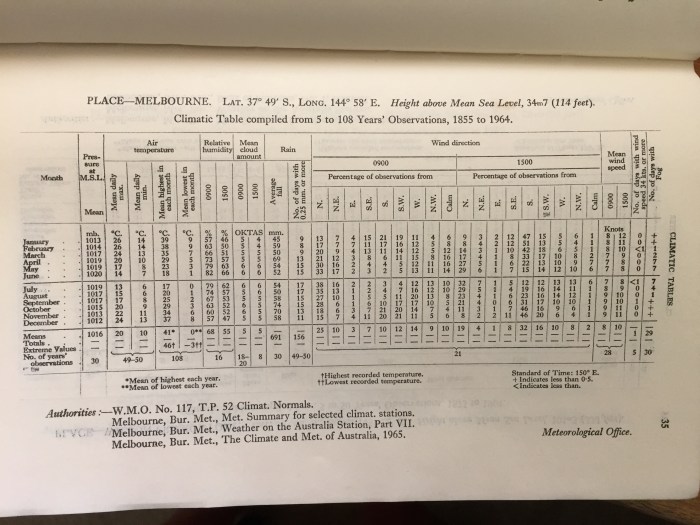
The equivalent data for the years from 1970 is available at the Bureau of Meteorology website. The data is for Melbourne.
Interestingly, a comparison of the mean daily maximum, minimum, mean highest temperature in a month and mean lowest in a month for the 108 years to 1964 (as above) shows virtually no difference at all to what is reported for the 46 years since 1970.
No difference. At all.
It is not this comparison alone that leads me to take claims that catastrophic warming has already commenced with a substantial degree of scepticism, but it is a wonderfully clear example. I wonder if those actuaries enamoured of climate change models are doing enough to bring the actual vs expected techniques to the table?
